- +1 (212)-695-1962
- info@elementskit.com
- 463 7th Ave, NY 10018, USA
Turn Your Data into Actionable Insights – Unlock the Power of Visual Analytics for Smarter Business Decisions!
Data Visualization Solutions by Highviz IT
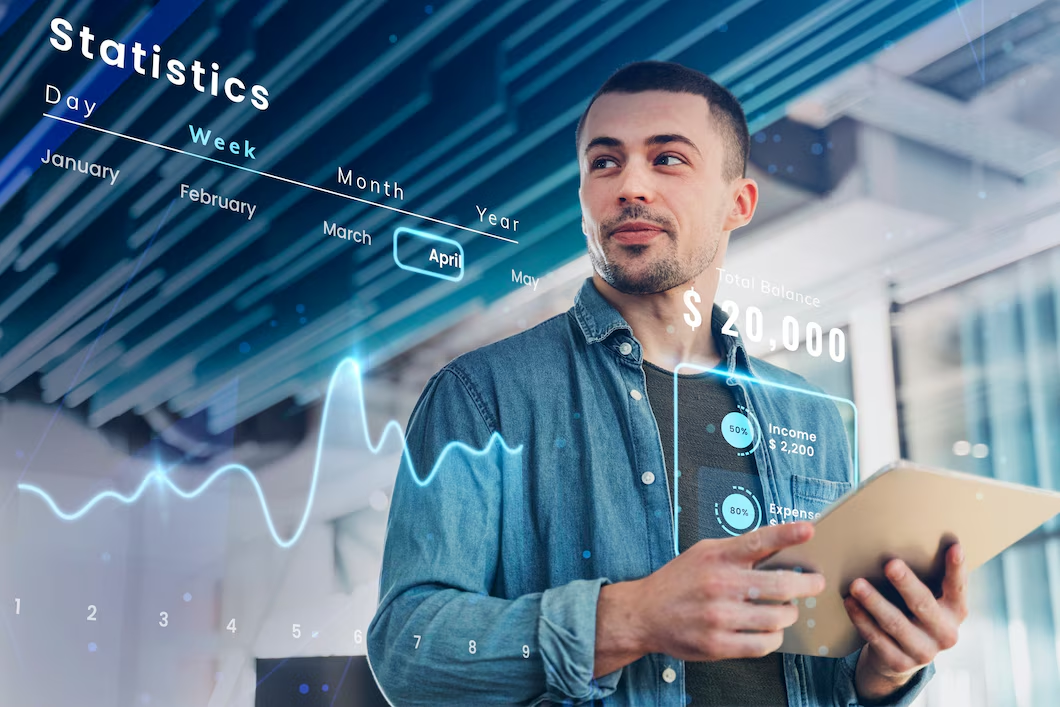
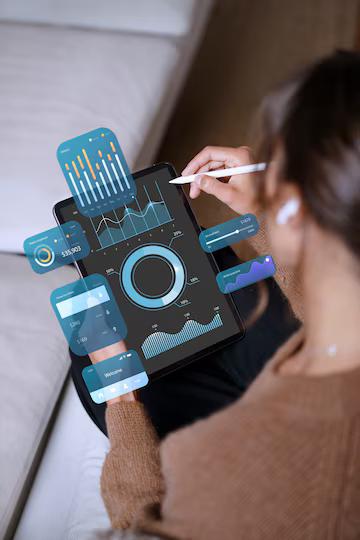
In today’s fast-paced business environment, data alone isn’t enough – you need to be able to understand and act upon it quickly. Highviz IT specializes in creating high-impact data visualizations that transform raw data into clear, actionable insights. Our Data Visualization Services make it easier for you to understand complex data, identify trends, and make faster, smarter decisions.
Our team of experts uses advanced tools and techniques to design visual solutions that are not only visually appealing but also informative and tailored to your specific business needs. Whether it’s interactive dashboards, dynamic charts, or advanced graphs, we deliver data visualization solutions that simplify decision-making and improve operational efficiency.
Why Choose Highviz IT Solutions for Data Visualization Service?
Highviz IT Solutions provides advanced data visualization services that transform complex data into clear, actionable insights, empowering your business to make informed, data-driven decisions.
Our Data Visualization Services
We create interactive and visually engaging dashboards and reports, tailored to your needs, to help you easily understand and analyze your data for better decision-making and strategic planning.

Interactive Dashboards & Reports
We create interactive dashboards that allow you to explore your data, visualize trends, and make quick, informed decisions. These dashboards provide real-time metrics, KPIs, and insights for your business.

Custom Data Visualizations
From bar charts and line graphs to heatmaps and scatter plots, we design a variety of visual formats to help you represent your data effectively. We tailor each visualization to suit your specific business objectives and data types.

Data-Driven Presentations
We help you create visually compelling presentations that convey your data insights in an easily digestible format. Whether for internal meetings or client reports, our presentations make complex data more accessible and engaging.

Advanced Analytics Visualizations
By integrating advanced analytics and machine learning techniques, we create visualizations that go beyond traditional charts. These include predictive models, trend forecasts, and anomaly detection visuals to help you stay ahead of the curve.

Real-Time Analytics and Monitoring
We provide real-time data visualization solutions that allow businesses to track key metrics and performance indicators continuously. These real-time visuals ensure that your team is always up-to-date with the latest insights.

Business Intelligence & Data Integration
We integrate data from multiple sources (CRM, ERP, databases) into unified visualizations, providing a comprehensive view of your business performance. Our solutions ensure data accuracy and consistency across all platforms.
Benefits of Our Data Visualization Services
Simplify data analysis, enhance decision-making, and improve stakeholder communication with our data visualization solutions that turn your raw data into clear, impactful visuals.
Better Decision-Making
With clearer, more concise visual representations of data, your team can make better, faster decisions based on real-time insights and trends.
Simplified Data Interpretation
Our visualizations simplify complex datasets, making it easier for non-technical stakeholders to understand and act on data without needing advanced analytics skills.
Enhanced Business Agility
Visualizing key metrics allows businesses to quickly respond to changes in the market, customer behavior, or operations. With faster access to actionable data, your business can adapt and stay competitive.
Improved Collaboration & Communication
Data visualization bridges the gap between departments by providing a common platform for understanding performance metrics. It enhances communication and alignment across teams, driving collaboration and efficiency.
Increased Engagement & Retention
Interactive visualizations increase user engagement, ensuring stakeholders stay involved and informed. Whether it’s an executive, manager, or analyst, everyone benefits from easy-to-digest, interactive visuals.
Scalable & Customizable Solutions
As your business grows, so do your data needs. Our scalable solutions can handle increasing data volumes, new data sources, and evolving visualization requirements, ensuring continuous growth and adaptability.
Get Started with Highviz IT’s Data Visualization Services
Effective data visualization is key to unlocking insights, driving decisions, and improving performance. At Highviz IT, we specialize in providing high-quality, custom data visualizations that turn complex data into clear, actionable insights. Whether you need interactive dashboards, custom reports, or advanced analytics, we have the expertise to create the right solution for you.
Frequently Asked Questions (FAQs)
What is data visualization?
Data visualization is the graphical representation of data. It uses charts, graphs, maps, and other visuals to help interpret and understand complex data, making it easier for decision-makers to identify trends, patterns, and insights.
How can data visualization help my business?
Data visualization helps businesses by turning complex datasets into intuitive, actionable insights. It simplifies decision-making, enhances communication, and allows for real-time performance monitoring.
What types of data can be visualized?
Any type of business data, including financial data, sales data, marketing metrics, operational data, and customer data, can be visualized. We tailor the visualizations to your specific business needs and objectives.
Which tools do you use for data visualization?
We use a variety of powerful data visualization tools, including Tableau, Power BI, Qlik, and others. We select the right tool based on your specific needs, budget, and technical requirements.
Can data visualization be integrated with my existing systems?
Yes, we can integrate data visualizations with your existing systems, such as CRM, ERP, and databases, to ensure that all your data is unified in one place and can be accessed easily through visualizations.
Is training provided for using the visualizations?
Yes, we provide training to help your team understand how to navigate and interpret the visualizations effectively. Our goal is to ensure that you can make the most out of the tools we implement.
